

Inventory
Every longline, cage and float on the books
Track submerged equipment and GPS it. Fewer losses, and a much easier conversation with your insurer and your bank when they ask what is in the water.
 Request a demo

New Zealand made · Mussels · Oysters · Seaweed
Mussel App runs the whole operation from the deck. Farms, lines, seedings, assessments, harvests and costs in one record, then it forecasts what is coming from your own farm history. Works with no signal and syncs when you are back in coverage.


Sector Pullao, Chiloé, Chile
The Skipper App
Farms, lines, tasks, seedings and harvests, with metres tracked on screen so crews can check progress without switching views.
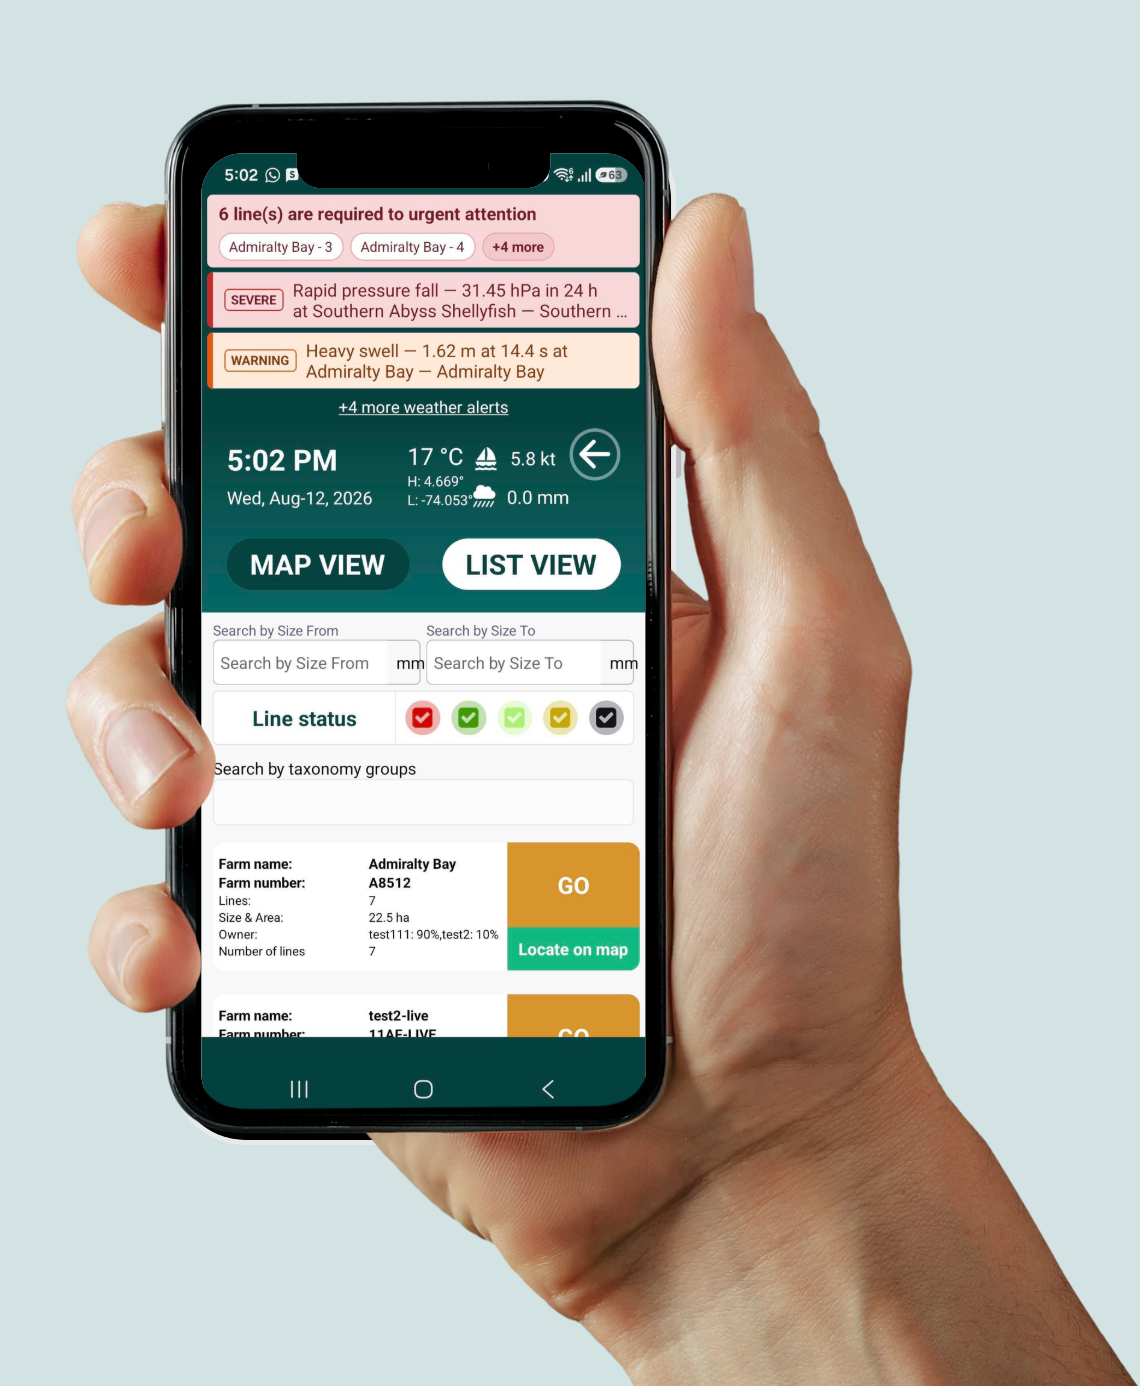
One app, end to end
GPS, stock management, farm management and task management in separate apps means the same job gets typed in three times and still does not reconcile. Mussel App carries biosecurity, insurance reporting, stock movement and profitability in one record.
Harvested weight and processed weight are tracked separately in the same harvest record. Set your own price per processed kg, harvested, brokens, smalls, biofouling or your own categories, with an effective date and full price history. Oysters priced per processed dozen. Budget and income forms show $/bag and $/kg side by side.
 From sea to sale
What it covers
These are the features that landed in the last year. Every month there are more, and most of them started as something a farmer asked for.
Track submerged equipment and GPS it. Fewer losses, and a much easier conversation with your insurer and your bank when they ask what is in the water.
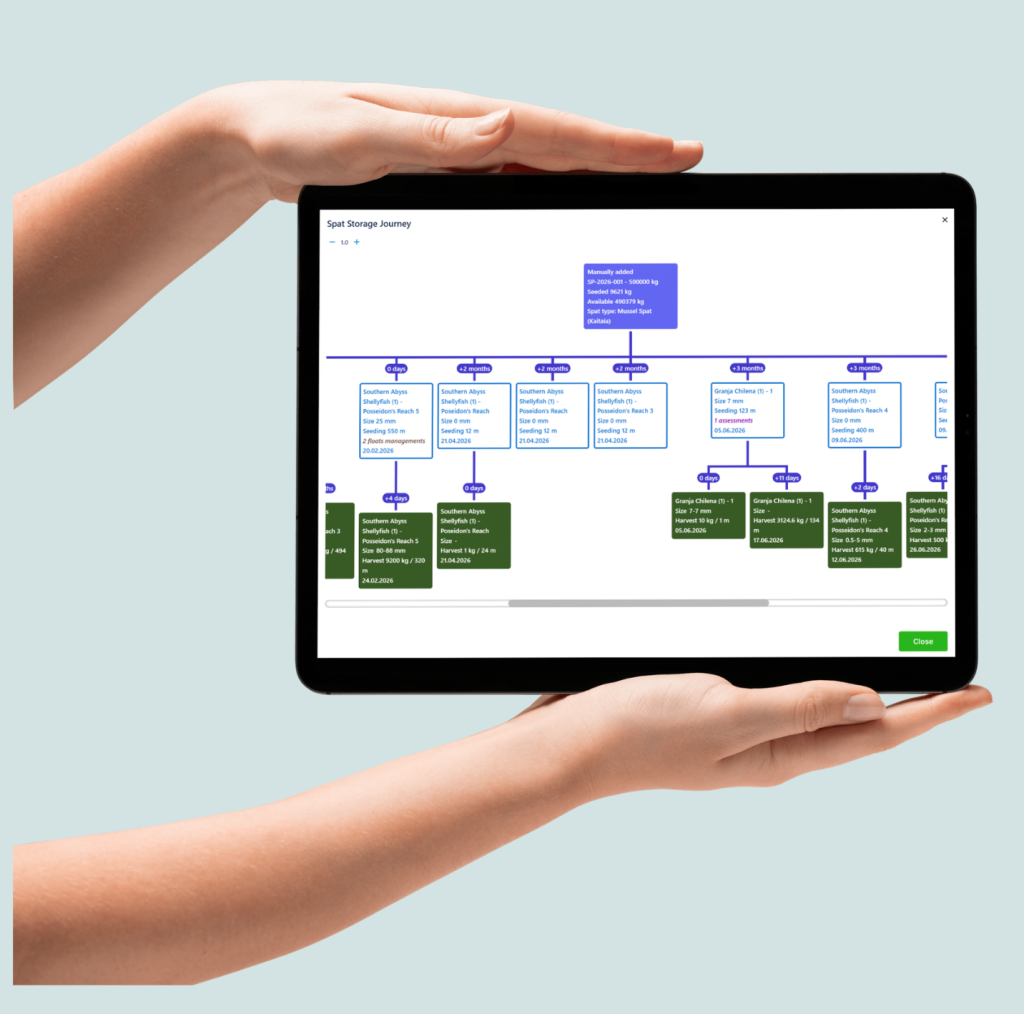
Every seeding, assessment, maintenance record and harvest stays linked. Delete warnings list what is attached before anything goes. Archive inactive farms and lines without losing their history.
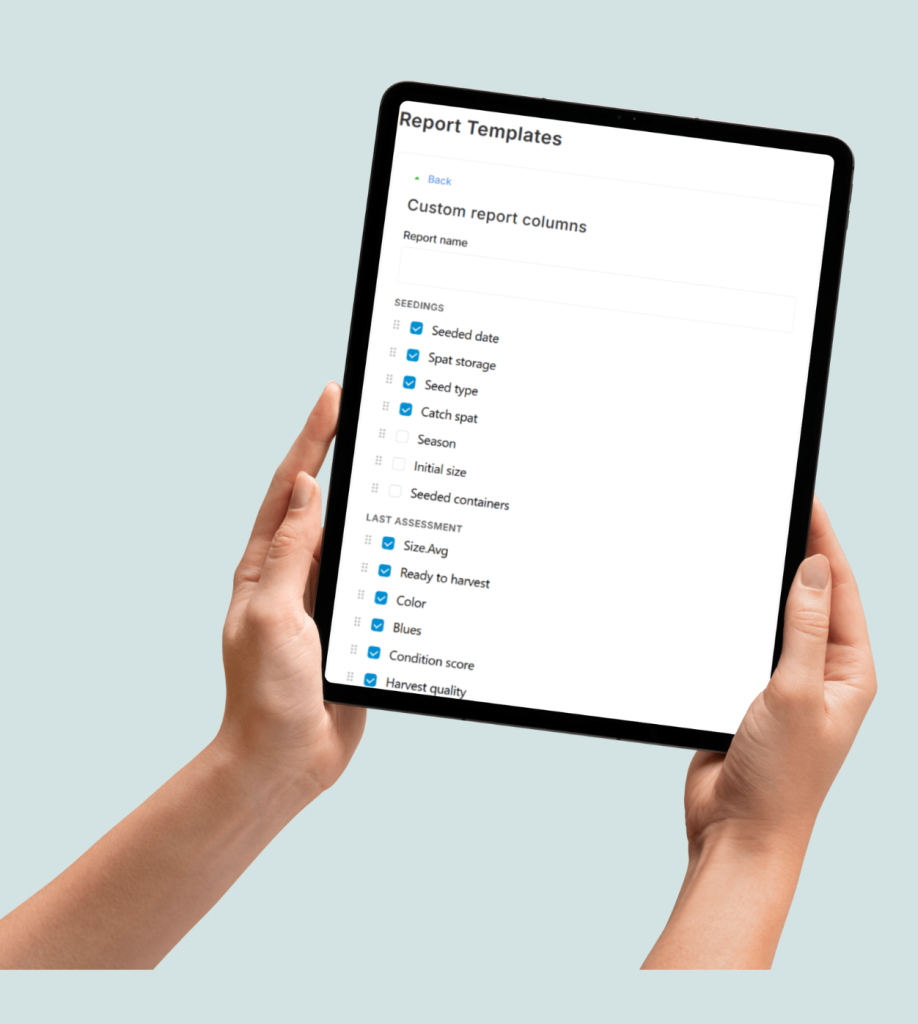
Keep the columns you need, drop the ones you do not, save the layout online, as PDF or Excel. Schedule them to arrive by email and download a full backup of your data any time.
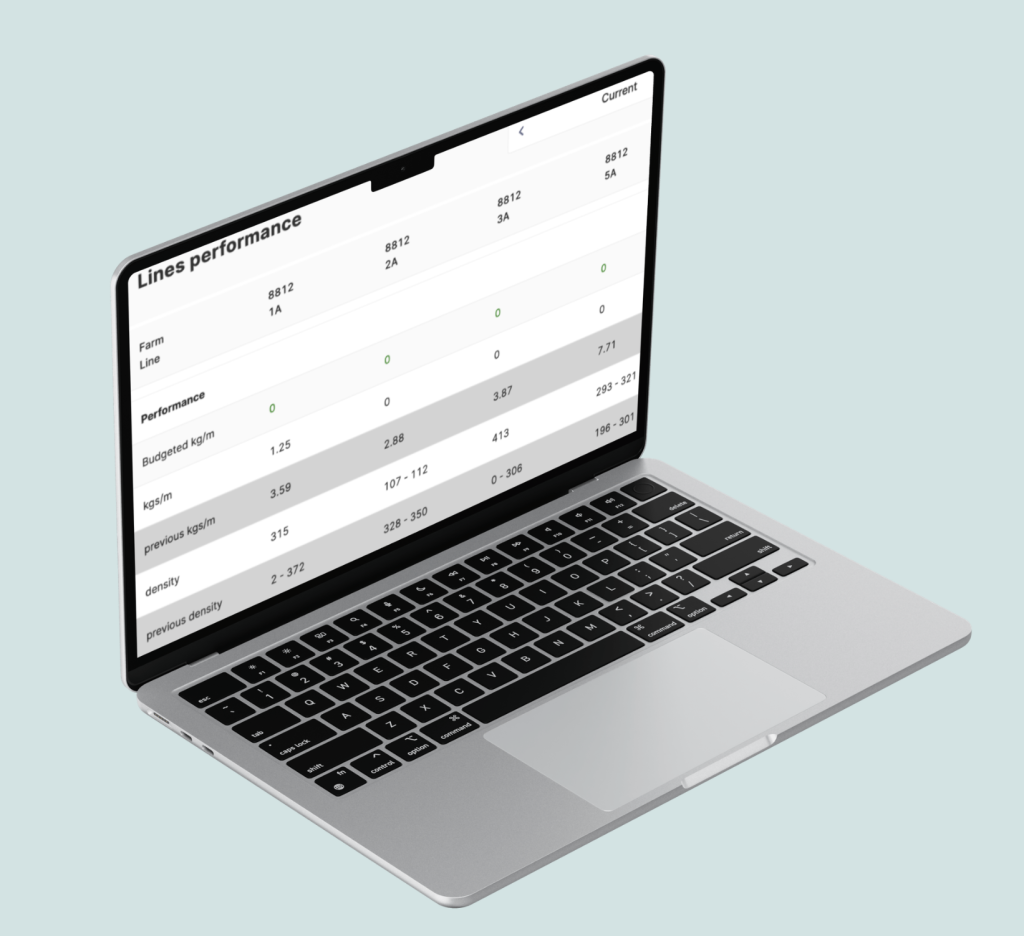
Harvested and processed weight tracked separately, priced per processed kg or dozen with effective dates and price history. Reports include performance, financial detail and a total of empty versus full lines.

Farm and line shown on every calendar task. Timesheets searchable by farm number, line, vessel or client, with comment templates and batch numbers. It remembers your last selection so nobody re-picks the same activity all day.

Weather data is joined to the lifecycle of your mussels, oysters and seaweed. Connect or import from your own sensors to sharpen forecasting and biofouling control.
 Desktop view
Oysters too
Oysters do not grow like mussels, so they are not forecast like mussels. Racks, baskets and lines, priced per processed dozen, with the same lifecycle, reporting and analytics behind them.
Spat Weather Analytics
Two years in the making, and as far as we know the first tool that runs this kind of live analysis on a single farm's own records. It reads your seedings, assessments and harvests, cross-references the weather your farm was actually exposed to during those periods, and surfaces the patterns already sitting in your history.

Scores are adjusted for farm, line, season and weather, so you are comparing spat on equal terms. Every insight tells you how many samples it is based on, so you know the difference between a lucky one-off and a real signal.
One catch worth knowing. We cannot go back in time to collect weather. Collection starts the day you join, and that is data nobody else has. Farmers with six months or more of records see meaningful patterns straight away.
Point the Skipper App at the plate and it reads the size. No calipers, no typing, no transcription errors at the end of a long day.
Quality issues get flagged automatically as records come in, rather than surfacing weeks later in a report nobody read.
Ask what is on Line 12 right now, or dictate today's assessment and have it recorded. It confirms before saving, and every entry passes the same checks as the app.
A dedicated page scans your records for anything inconsistent, like an assessment dated before its seeding or a final harvest with no amount, so the analytics are not learning from bad data.
Forecast from your own records, with mussels and oysters modelled separately. Stage Reseeding shows which lines are ready to move up, with a confidence score that climbs as your history grows.
When a forecast is off by two weeks or more it gets recorded and used to improve the next one. Not a list of failures, just how the model gets sharper on your farm.
In testing now
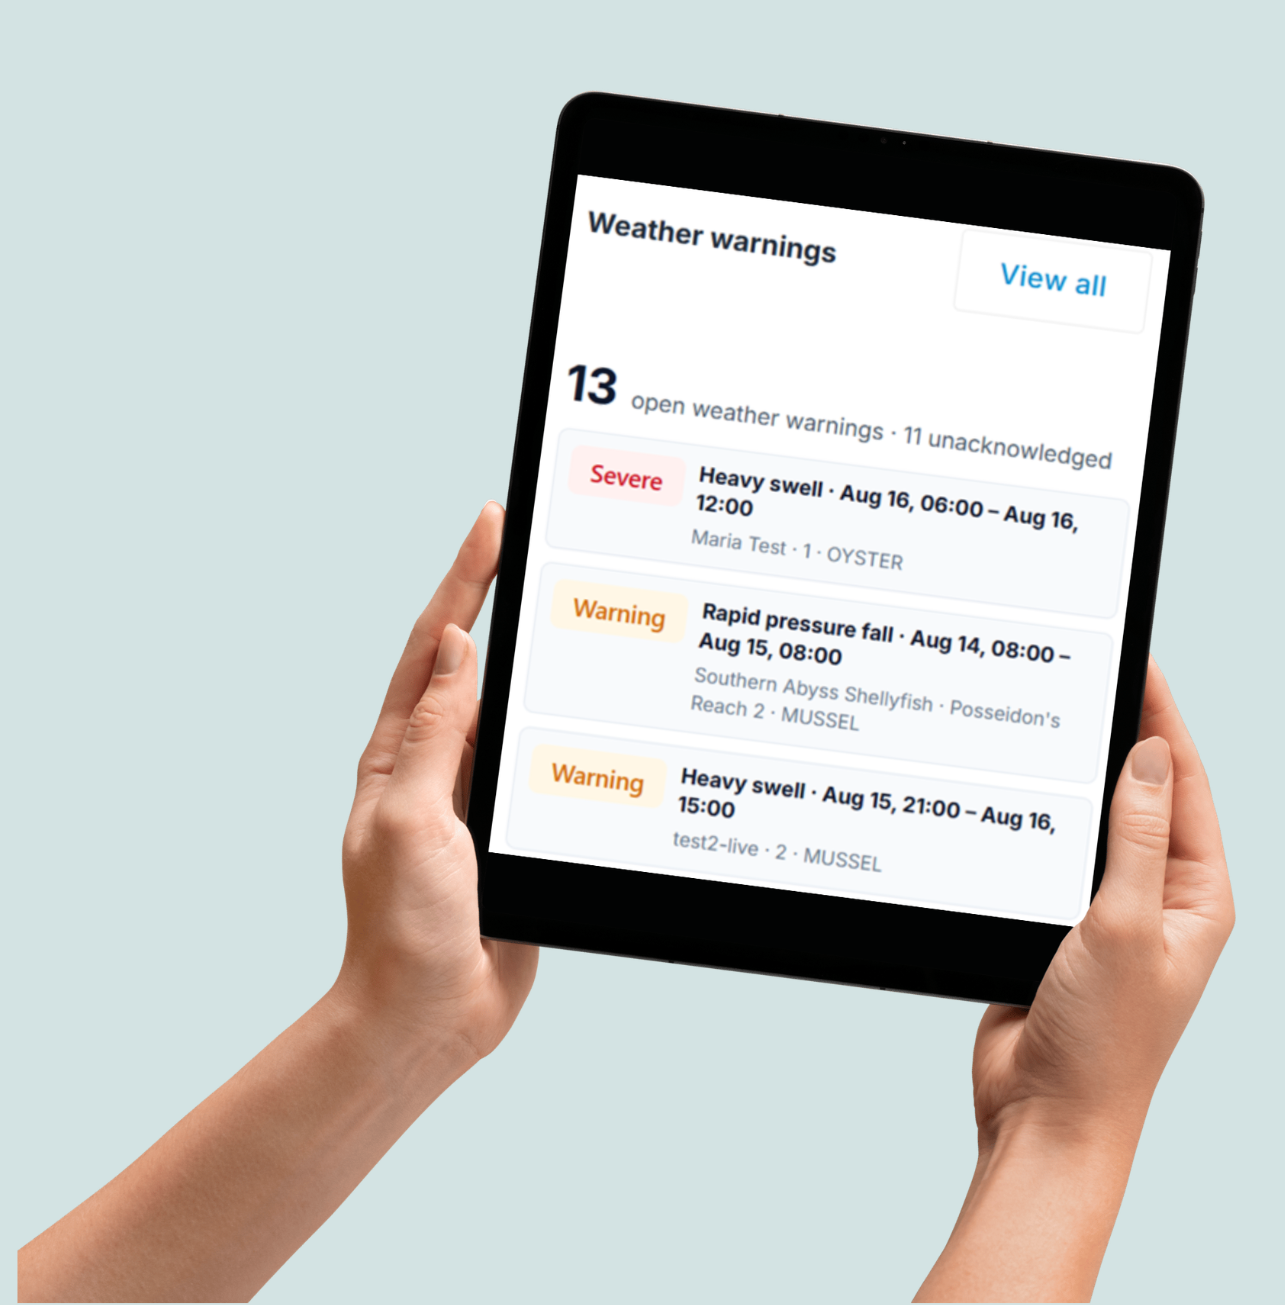
Not another forecast. Instead of "gusts to 38 knots Saturday", you get: gale conditions from 3am to 2pm on Farm 12, against the 34-knot limit you set, secure loose gear Friday. It also tells you which days are workable, because a system that only brings bad news gets muted, and then the warning that matters never arrives.
Meet Shelly
Call or message at the end of the day and she logs it into your system properly. She will get on the phone with your skippers to fill in what is missing, and explain how your records are set up.
You have been on the water since before dawn. The data entry can be someone else's job.
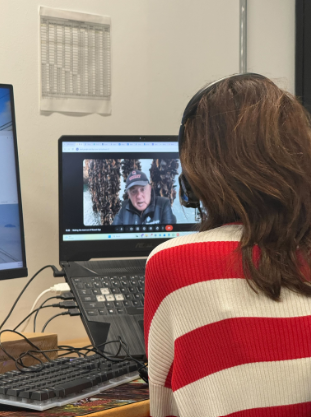
"Ready to harvest lines, empty lines, assessments, at the click of a button is fantastic."
Hika's team have run the app across day to day farm management for a year: the traffic-light farm map with add and subtract floats, the calendar and task functions, printed or big-screen farm overviews for the ops crew, and line assessments captured on an iPhone or iPad with real time photos.
Pricing
$80 USD minimum per account, per month
One rate, counted the way your farm is actually laid out. The asterisk matters, because not every structure is a line.
A raft carries many droppers, so it is counted as several line equivalents rather than one. Oyster racks, baskets and seaweed lines are counted by structure too. Small farms land on the $80 account minimum, which covers the platform and your onboarding either way.
The estimator below shows you roughly where you would sit.
Estimate your monthly figure
These numbers are indicative and are here to give you a rough sense of scale. They are not an offer, a quote or a contract, and nothing here forms a binding price.
Figures are in US dollars and include the $80 per account, per month minimum. Real pricing depends on your structure types and sizes, how rafts and racks are counted on your farm, your region and your account setup. The raft factor above is an illustrative default, not your farm's number. Your actual figure is worked out with you on the demo call and confirmed in writing before you start.
Nobody hands you a login and wishes you luck. Onboarding is part of the price, whether you run 40 lines or 4,000.
Also on the platform
From the log
Development notes written for farmers, not investors.

Most of the engineering did not go into generating more alerts. It went into deciding what the system should not say.
Read it ↗
Two years of work to answer the question that has always been answered by gut feeling: which spat performs best on your farm, in your water.
Read it ↗
A real person who takes the end of day call and puts your records in properly, so the skipper does not have to.
Read it ↗Request a demo
Tell us where you farm and what you grow. We will set up a call, walk you through the app against your own operation, and give you a real price for your structures.